Google Analytics key features and setup
Before we start setting up Google Analytics, two questions arise: "What is Google Analytics?" and "Why do we need Google Analytics?".
Google Analytics is a free Google tool used to collect statistics in the form of tracking website traffic. Why do we need it? We think you already understand why.
Whether you are the owner of an online store or a blog, your goal is to satisfy the user and understand his needs.
What it searches for, where it searches, where it searches from, from which device it searches, which browser it uses, how it accesses the website ......
Take for example an online store that sells certain products. Your goal should be to study and understand the needs of your customers to provide them with an ideal user experience. Google Analytics would provide you with all the information you need through several key factors to consider.
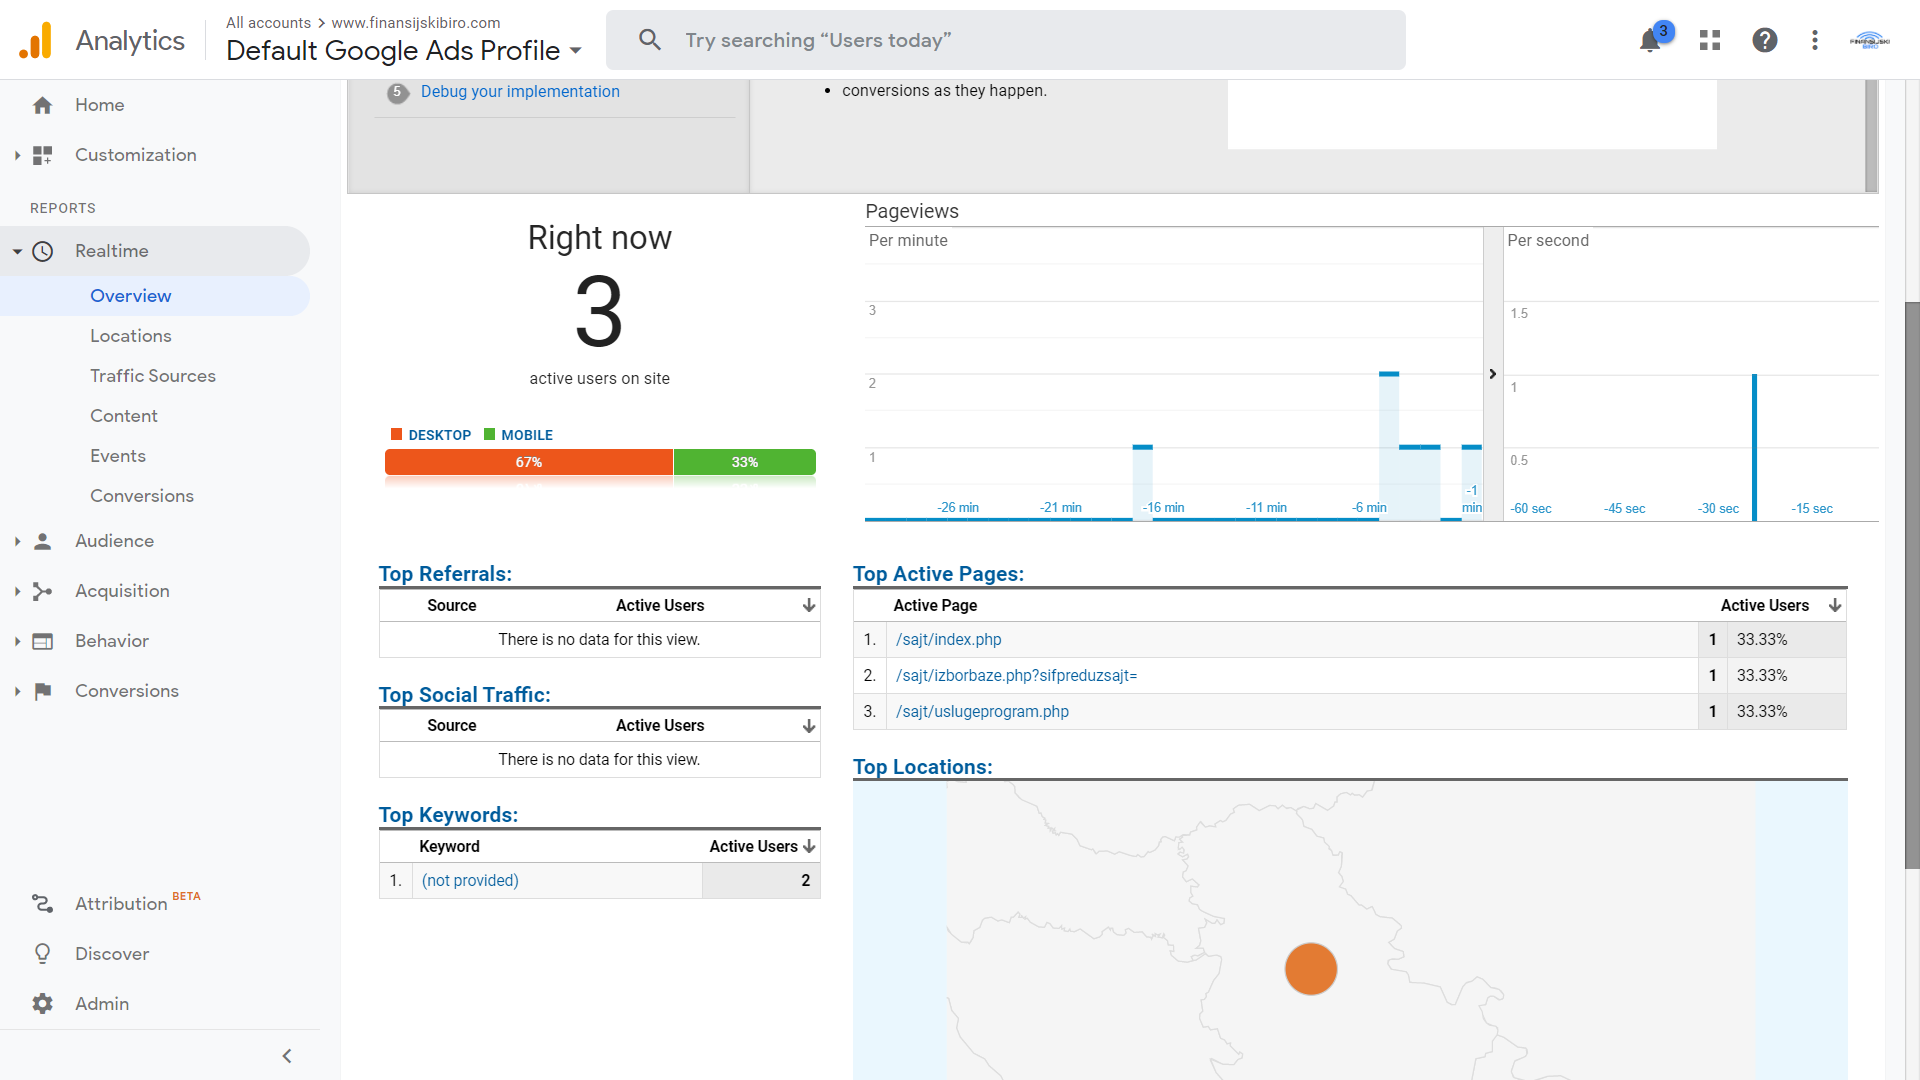
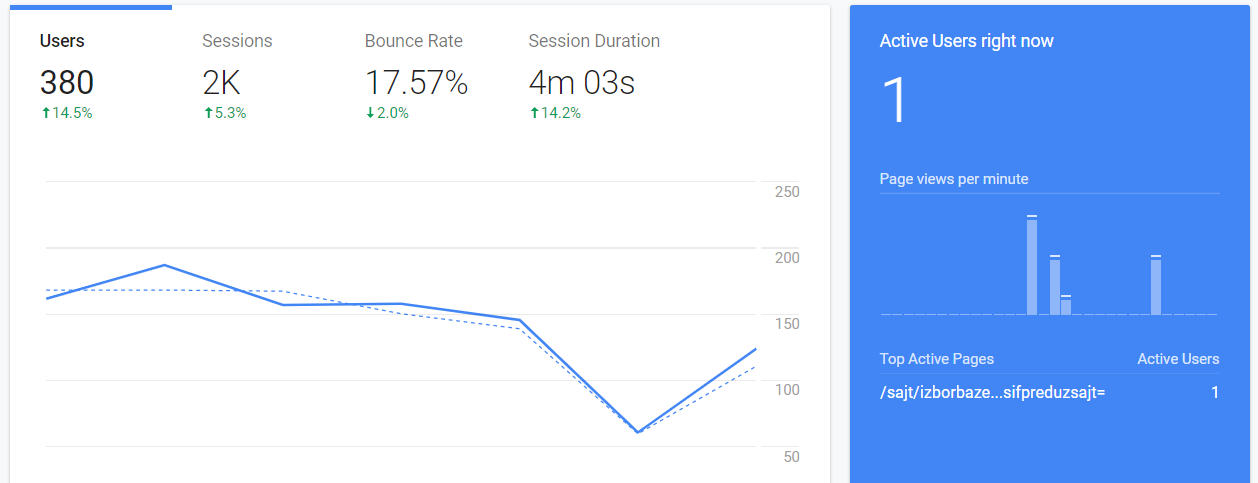
1. Number of users on the site in real time
As the title itself says, you get a real-time view of the user on your website. And not only the number, but also the pages they view, the geolocation, the device through which they access the site ... This information can be useful if you are planning a certain change on the site, and you do not want site users to spoil the experience by blocking the site certain time. You are always able to check the situation and decide whether to wait with the changes or change the page because users are not currently visiting it.
You can access the user's view in real time in several ways: via the Google Analytics Home page , the "Home" option , or in the menu list, by clicking on the "Realtime" option and then on "Overview" . The second approach shows the more detailed information we talked about above.
Example shown in the picture:
2. Traffic source
One of the simplest but still the most important metrics that Google Analytics can offer.
To find out which sources bring you the most traffic, click on "Acquisition" and then on "Overview". By clicking on "Overview" we get a complete overview of all traffic sources.
Example in the next two pictures - Detailed description below.
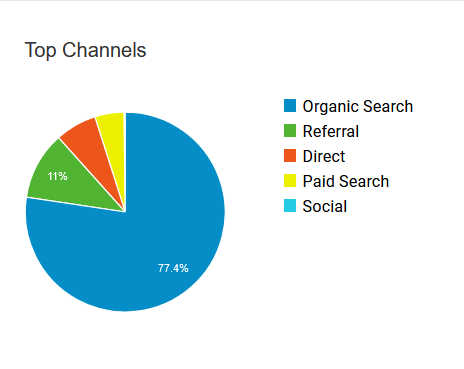
There are 6 traffic channels.
These are:
- Direct Traffic - These users came to your website by entering the URL directly into the browser's address bar.
- Organic traffic - These users found your website in a regular search on Google or another search engine. If you focus on search engine optimization, this is a very important tracking channel.
- Paid Search - These users come from your paid search ads that appear in search results.
- Display Network - These users found your website by clicking on the ad you were displaying on another website. Banner ads on blogs and image ads on websites are some common display traffic generators.
- Referral - these users have clicked on a link from another website.
- Social - This traffic comes from people who found your site via a linked account on social networks (Facebook, Twitter, Linkedin, Instagram ...)
For each of these channels there is the possibility of obtaining even more information - by clicking on the desired channel.
The following example shows more information for a Paid Search channel:
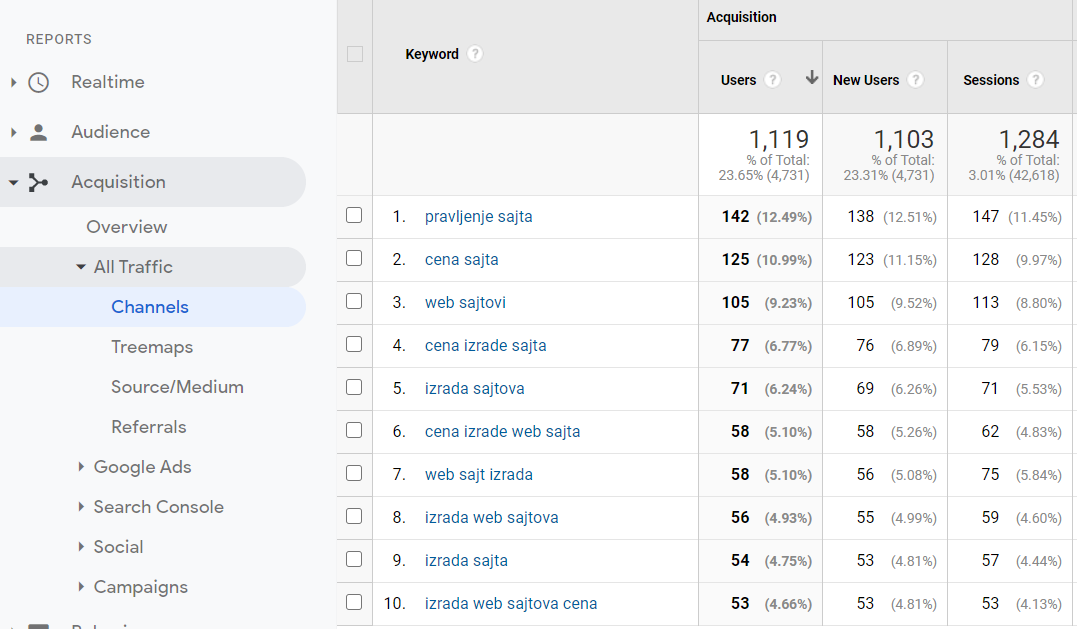
We've obtained valuable information about the keywords that users who accessed the site used to show our ads.
The same principle applies to each of these channels - e.g. if we had chosen a more detailed report on Referral traffic, we would have received detailed information on which website sends us the most traffic, how long these users stay on the site, etc.
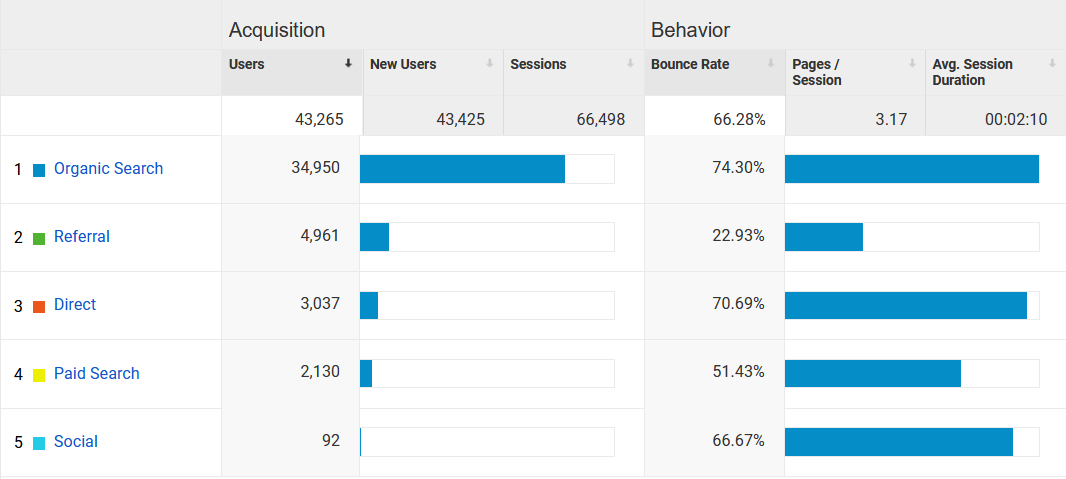
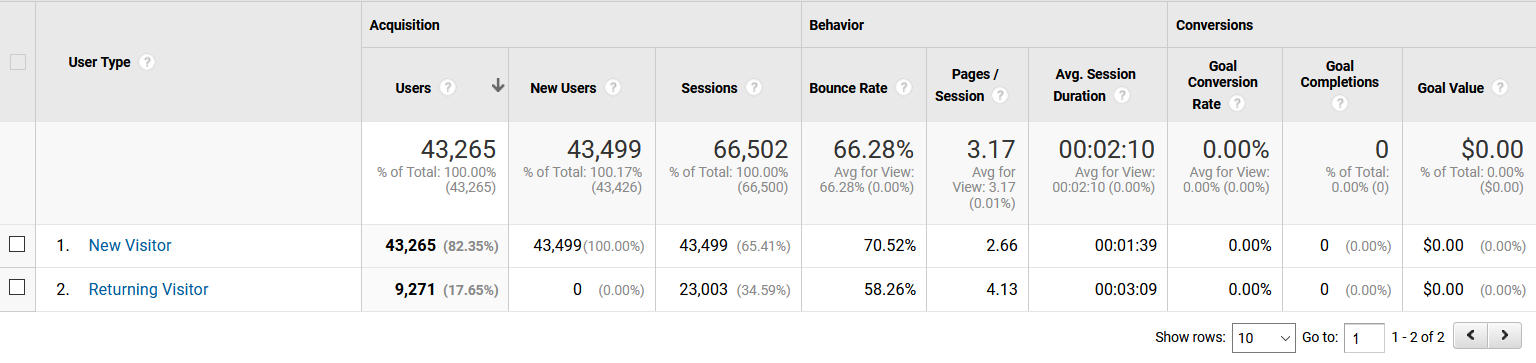
3. New users in relation to return users
It is a simple display of comparisons between new and return users in the table.
We can get valuable information such as: number of sessions, rejection rate, number of open pages per session, average session secrecy ...
Example in the picture:
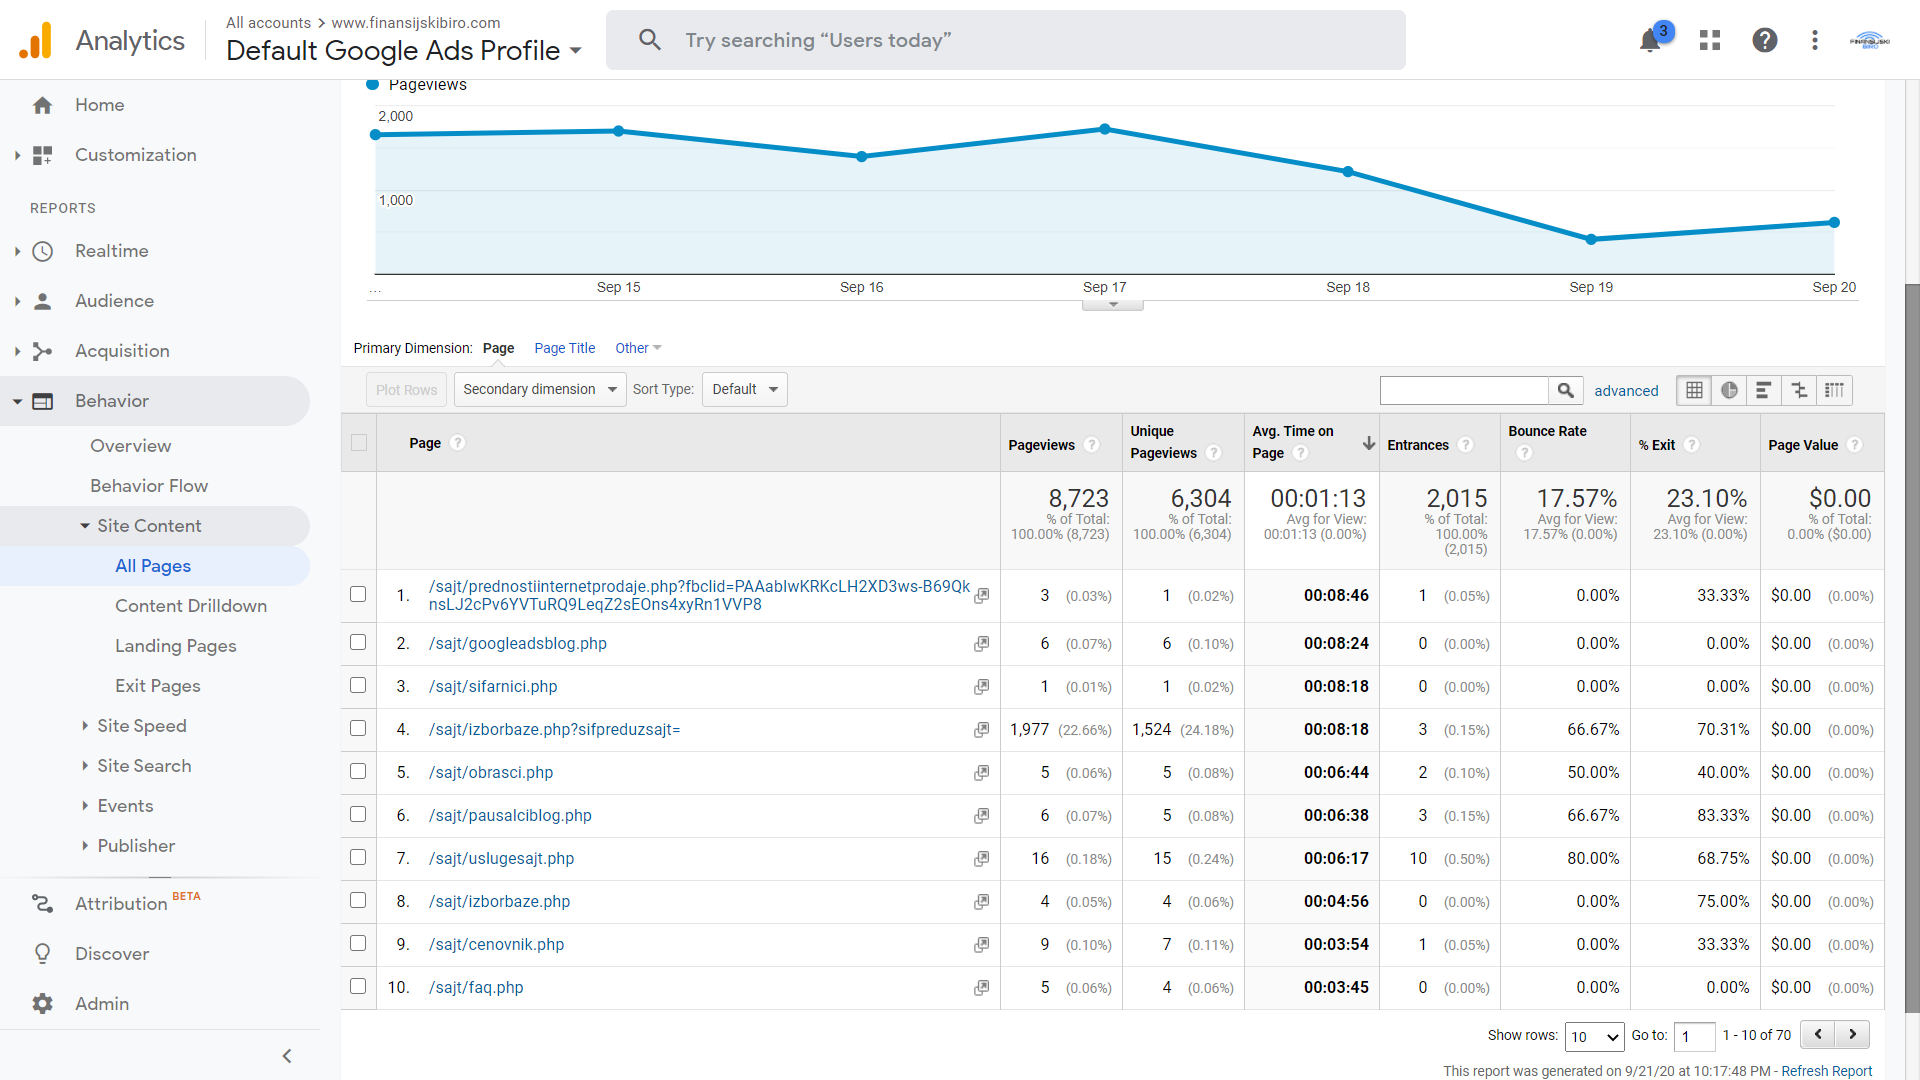
4. Average time spent on pages
We get it by selecting the "Home" option , then scrolling down to the very bottom of the page and finding the "PAGES REPORT" option , another way to access this report is to find the "Behavior" option in the menu , then "Site Content" , and then click on the "All Pages" option .
We look at the average time in the column "Avg. Time on Page" by clicking on the column we sort the report according to the needs.
Example report shown in the picture:
5. Bounce rate
Another very important factor that gives us information about rejection. In analytics, rejection is counted separately as a session that triggers only one request to the Analytics server, for example when a user opens one page on your site and then immediately exits without starting any other pages / requests for the Analytics server during that session.
Is a high rejection rate a bad thing?
It depends.
If the success of your site depends on users browsing as many pages as possible, then it is. For example, if your homepage is just a gateway to the rest of your website (e.g., news, product pages, your services, price list ...) and a large percentage of users visit only the homepage, then you want to reduce your bounce rate.
On the other hand, if you have a website with one page like a blog or offer other types of content for which sessions are expected on one page, then a high rate of visits to only one page is quite normal.
You can see the average rejection rate on the Google Analytics Homepage by clicking on the "Home" option .
Bounce rate shown in the example:
We get the rejection rate for special pages in the same way as the average time spent on the page, following the next steps in the menu we find the option "Behavior" , then "Site Content" , and then click on the option "All Pages" . For each page we look at the "Bounce rate" column .
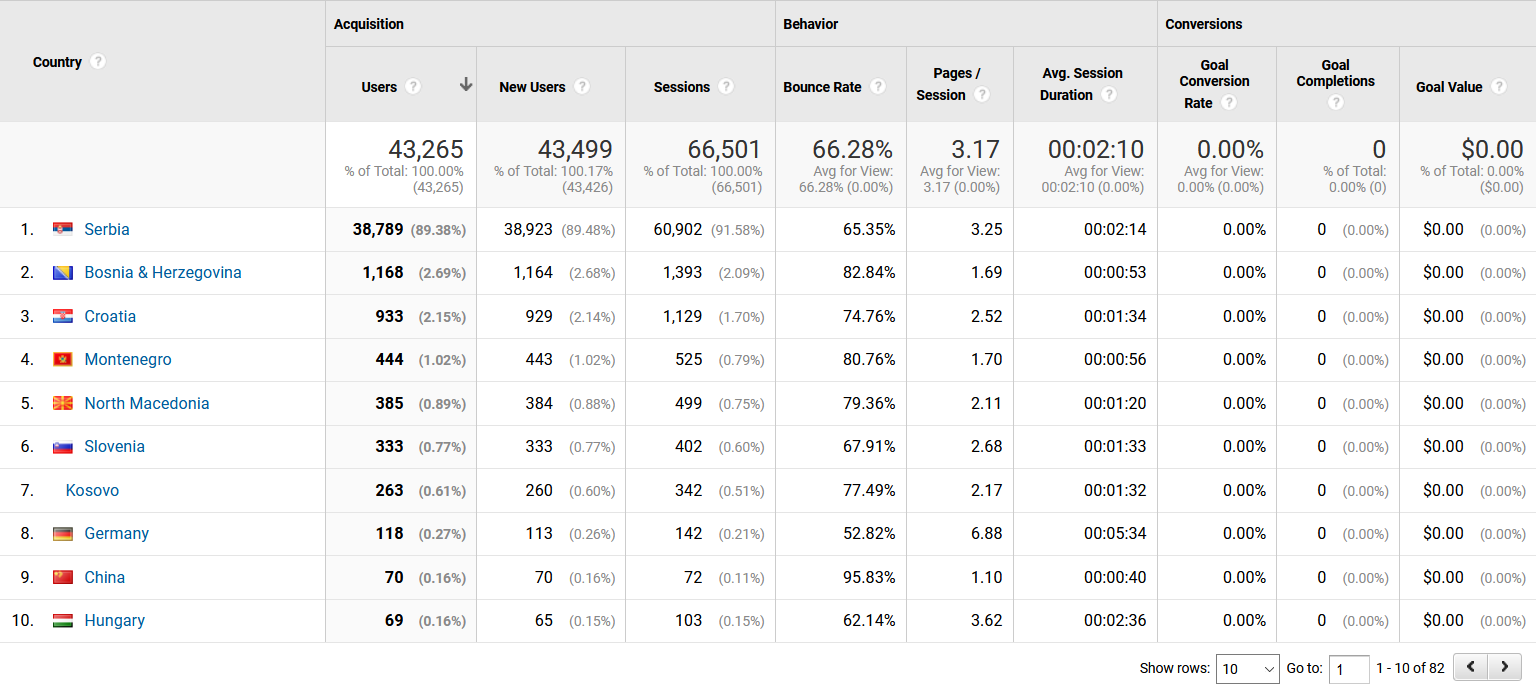
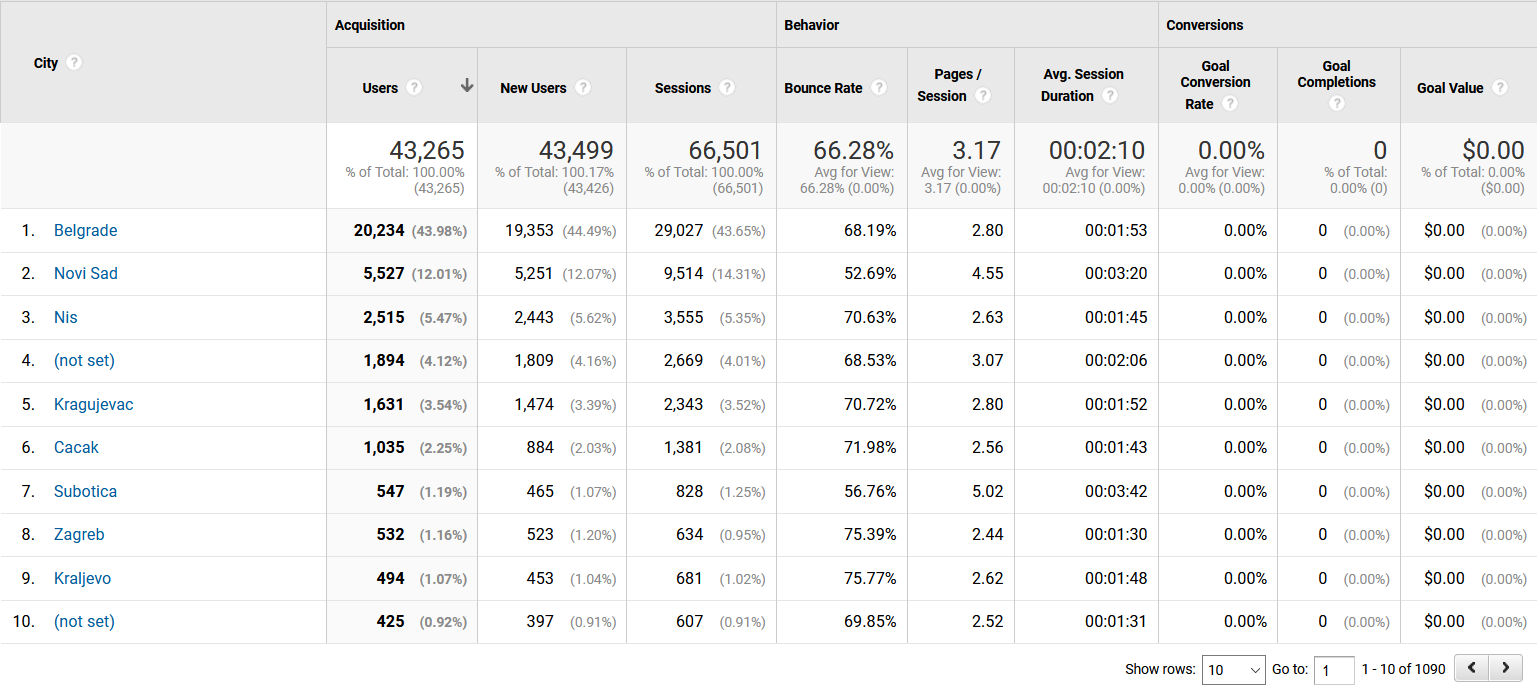
6. Locations (Country / City)
We access the location data as follows by clicking on the "Audience" option within the main menu, then "Geo" , and then "Location" .
The standard display after selecting these options is the display by country, there is the possibility of display by cities, continents.
Example display by country:
Example of display by cities:
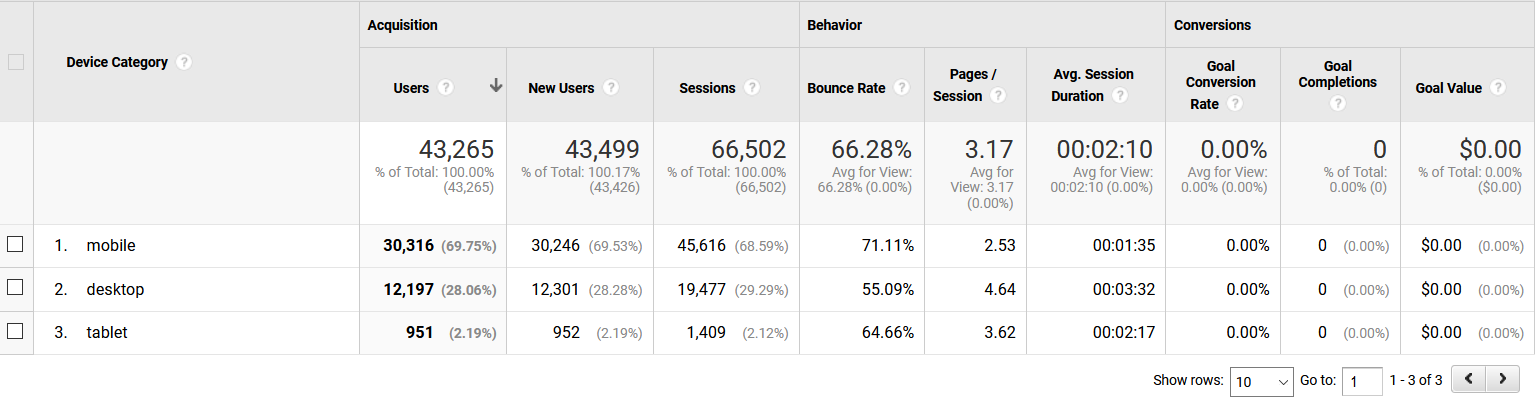
7. A device through which users access content
It is very important to understand that we live in the age of smartphones and tablets, so you need to adapt the content of your website to be available on all types of screens.
Read more about it in our blog post on Responsive Design.
You access the detailed report via the following path: click on the "Audience" option within the main menu, then "Mobile" , then "Overview" .
Example shown in the picture:
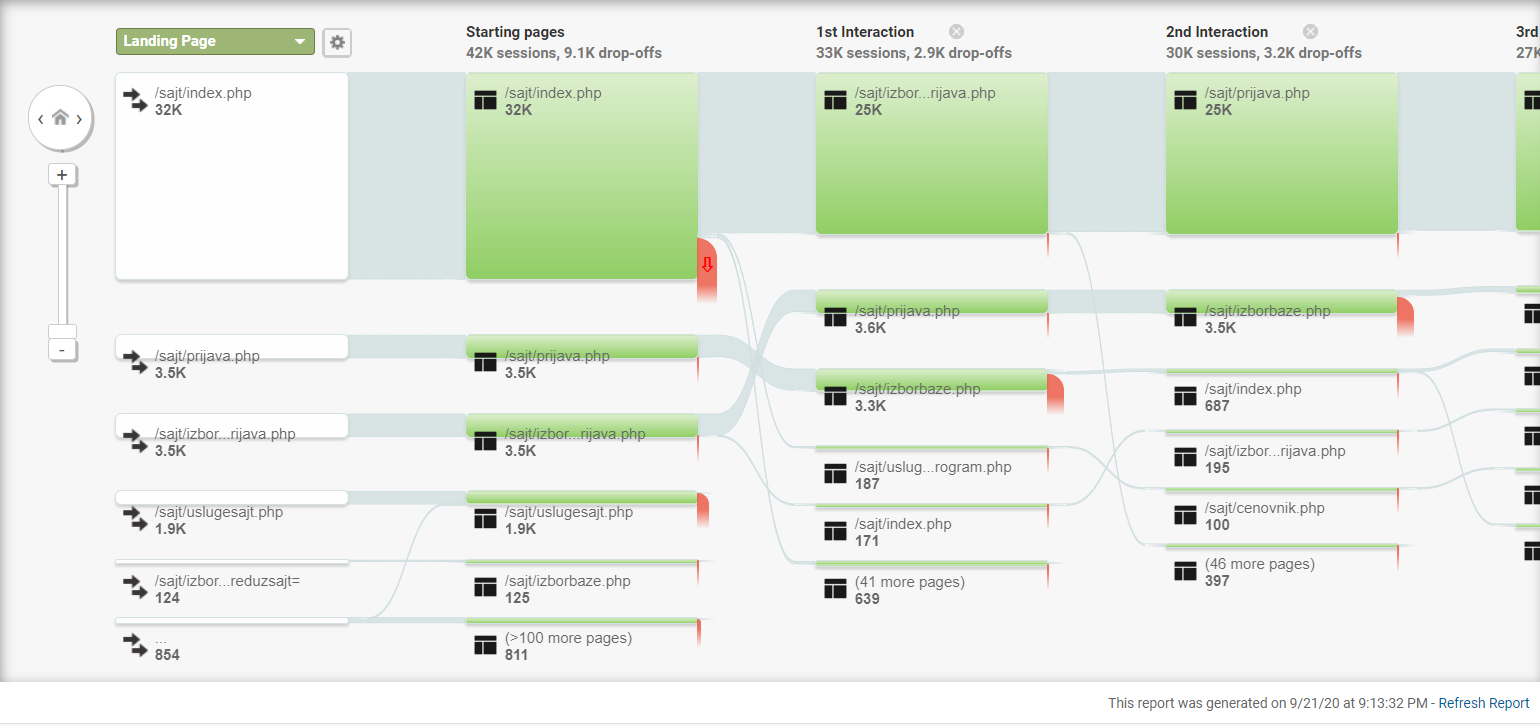
8. The course of behavior
The flow report looks very strange at first glance, but try to concentrate and you will find that it is very useful and easy to review.
This option allows you to see how users behave as they go through your website.
To access the report, click on "Behavior" and then on "Behavior flow" .
An example of the flow of behavior shown in the figure:
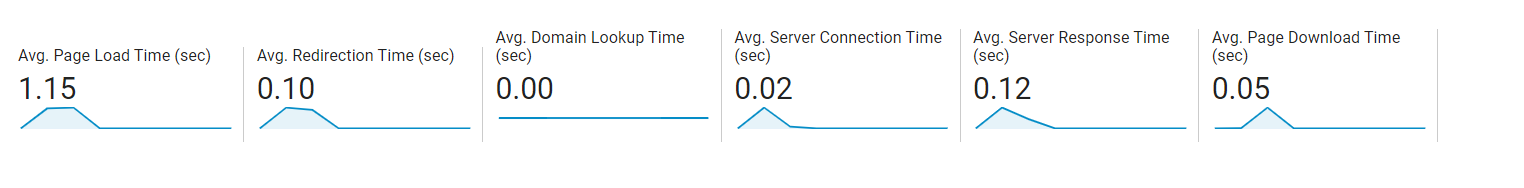
9. Site loading speed
This is an important ranking factor, an incredibly important usability factor and an even more important competition factor.
If the page on your website doesn't load fast enough, the user is likely to bounce back and find another, faster page to load from which to gather the necessary information..
They won't see your content either. Don't let that happen to you!
To get this report click on "Behavior" , then "Site speed" and finally "Overview" .
Example of site load speed:
These are just some of the great Google Analytics tools, you can expect more detailed content and solutions to certain problems related to Google Analytics results in one of the next posts.
And now - we move on to:
Implementation of Google Analytics
Implementing Google Analytics is a very simple process and does not require any special programming knowledge.
Try the following steps and your Google Analytics will be ready soon:
First of all, you need to have an e-mail address that will manage Google Analytics.
After logging in and connecting the analytics to the E-mail address, it is necessary to follow the following steps:
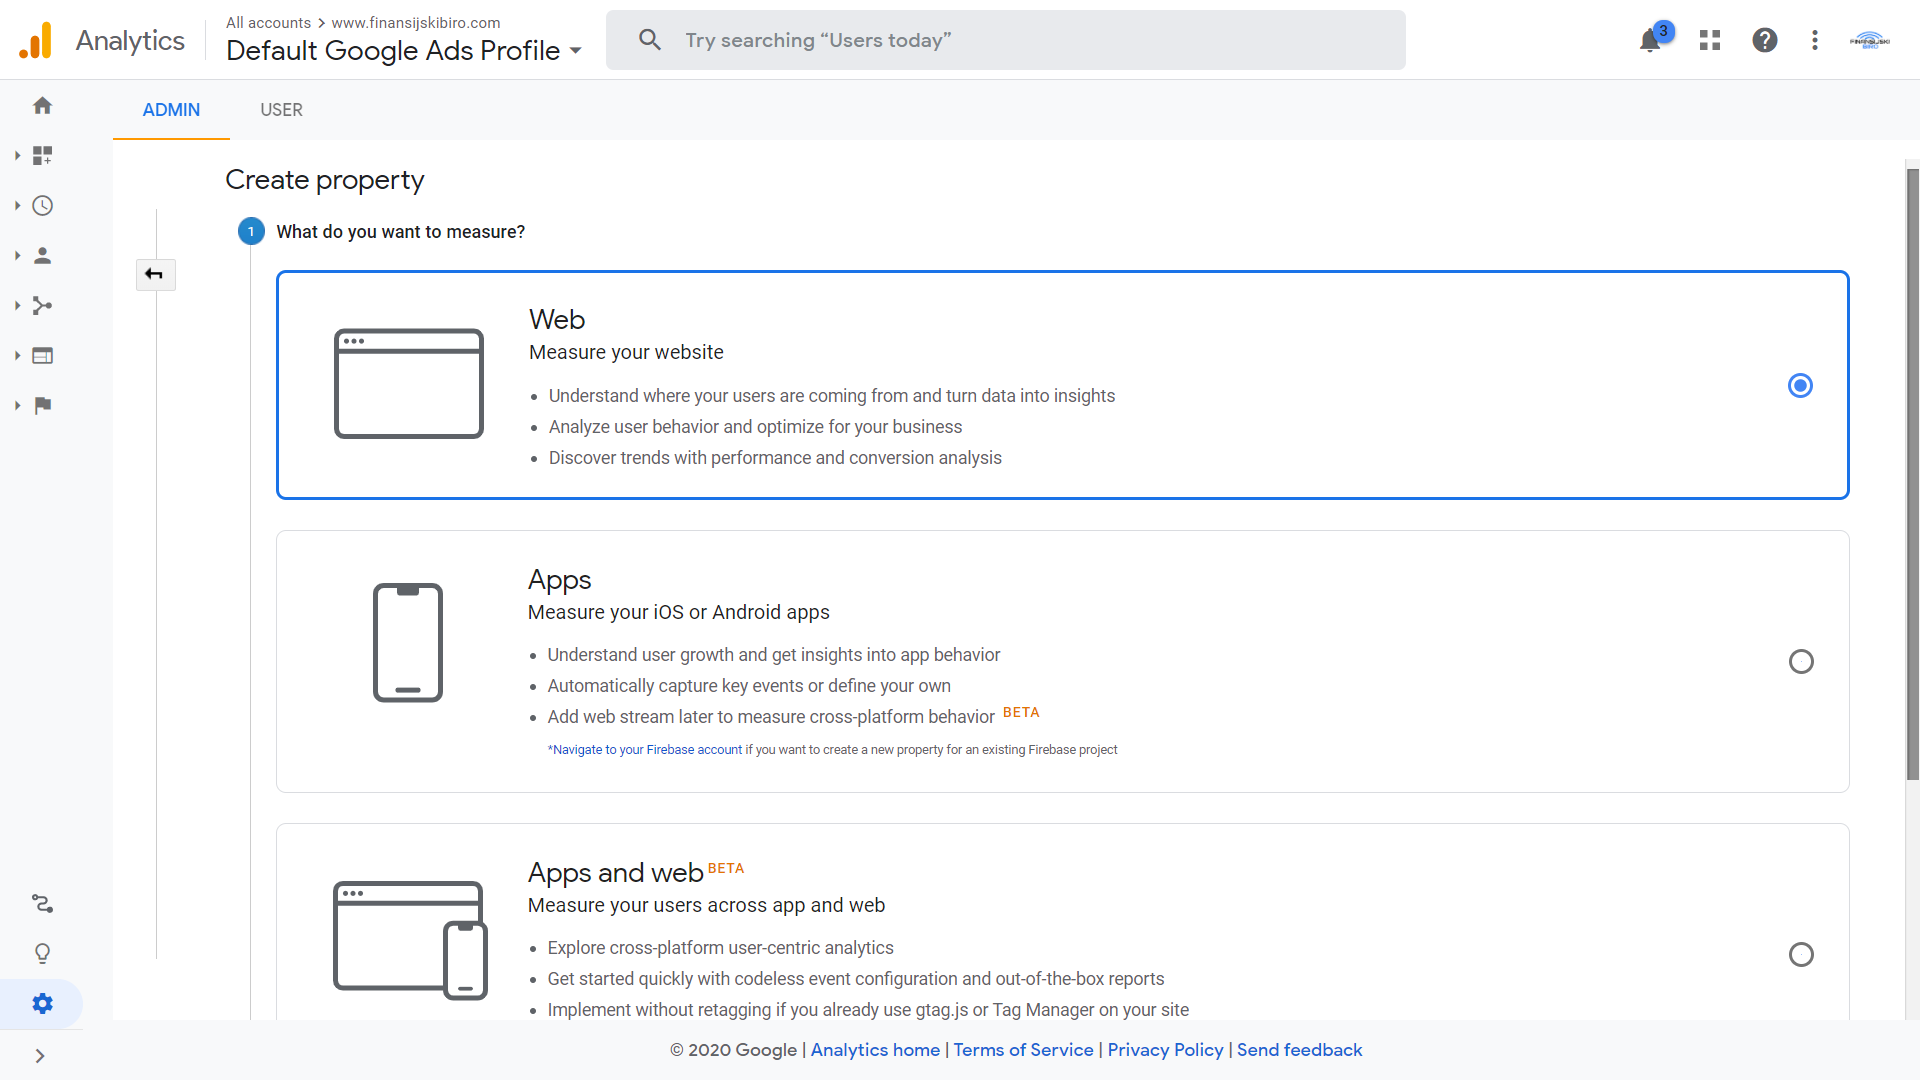
The first question from Google Analytics is "What do you want to track?"
- There are two answers depending on your needs you choose the Web or Apps option the first option is for the website and the second for tracking the statistics of iOS and Android applications.
- After the election we go to the "Continue" option
Example shown in the picture:
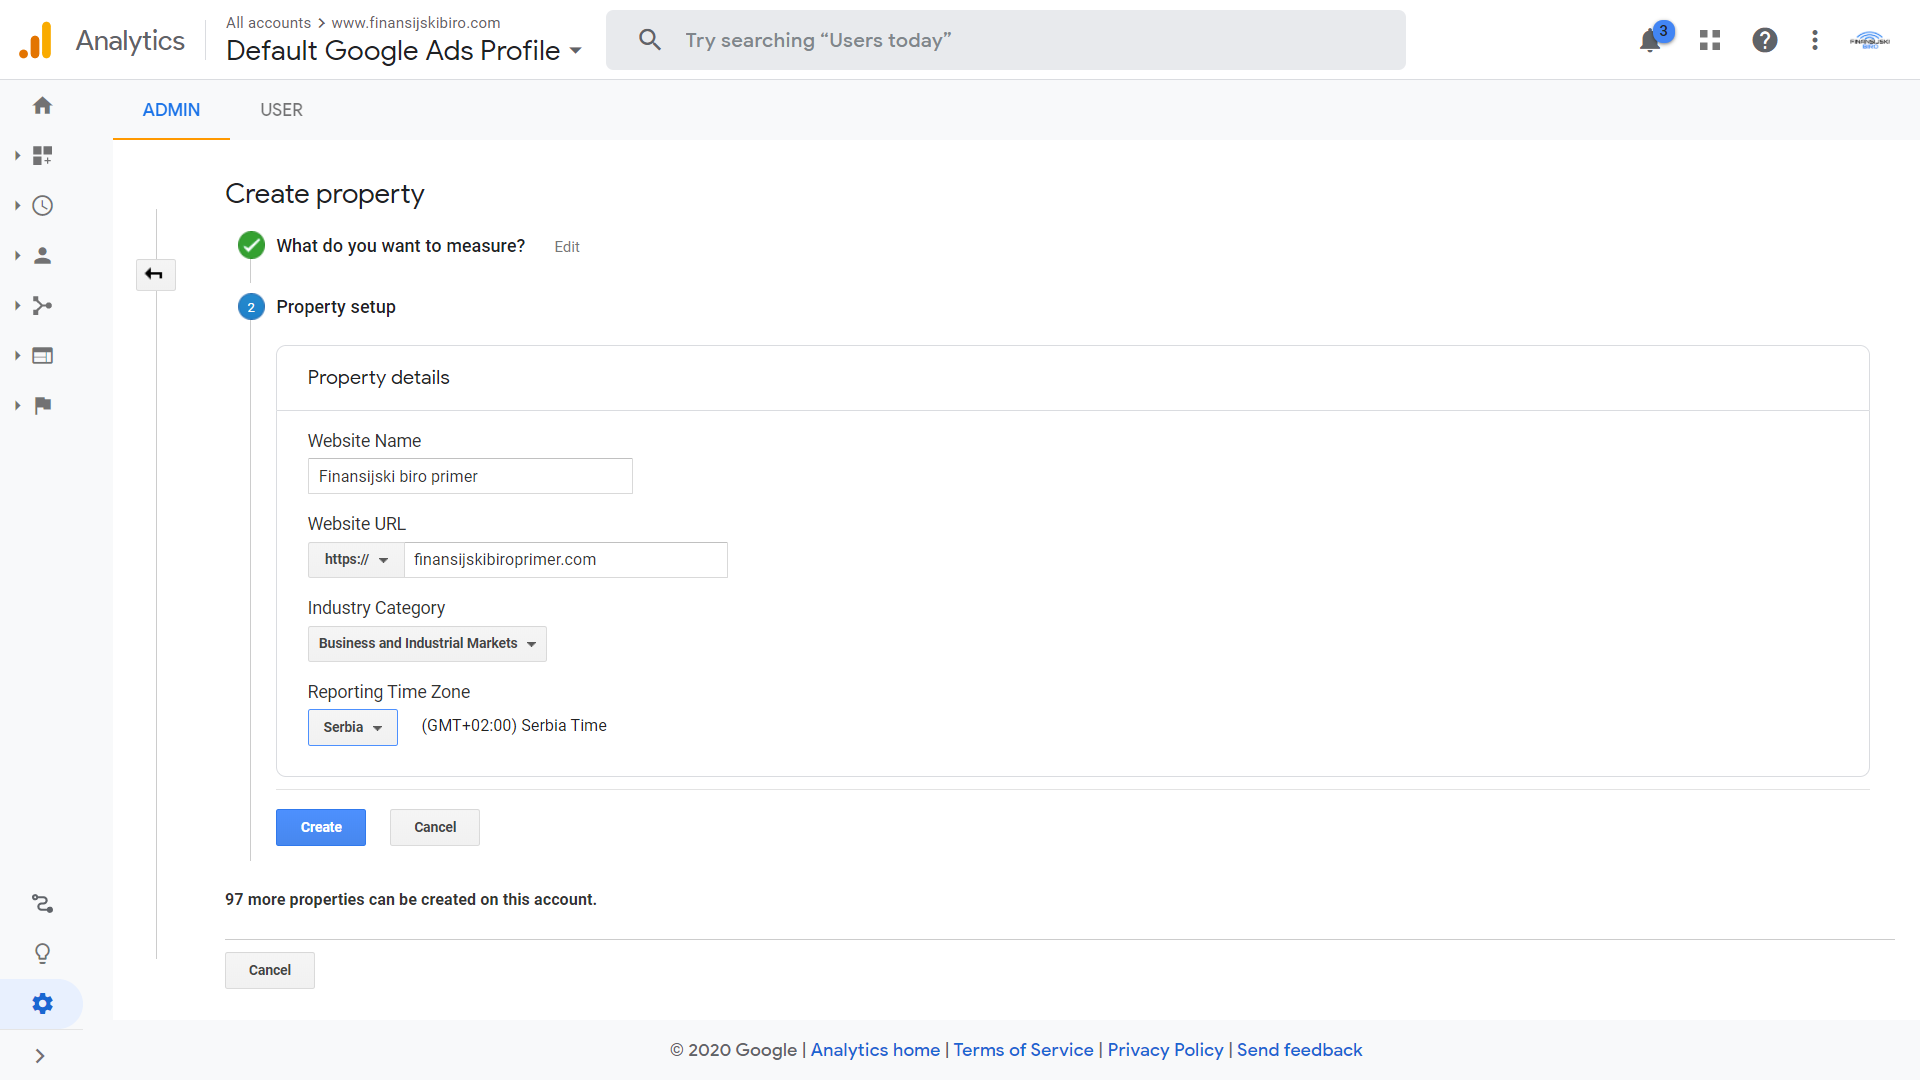
Questionnaire No. 2 "Details of your ownership - information about your website"
- You need to enter the name of your website, the URL of your website, choose the category of the company and choose the time zone.
- After that we go to the "Create"button .
Example shown in the picture:
You have successfully created ownership of Google Analytics, but it is not yet ready for use.
Example shown in the picture:
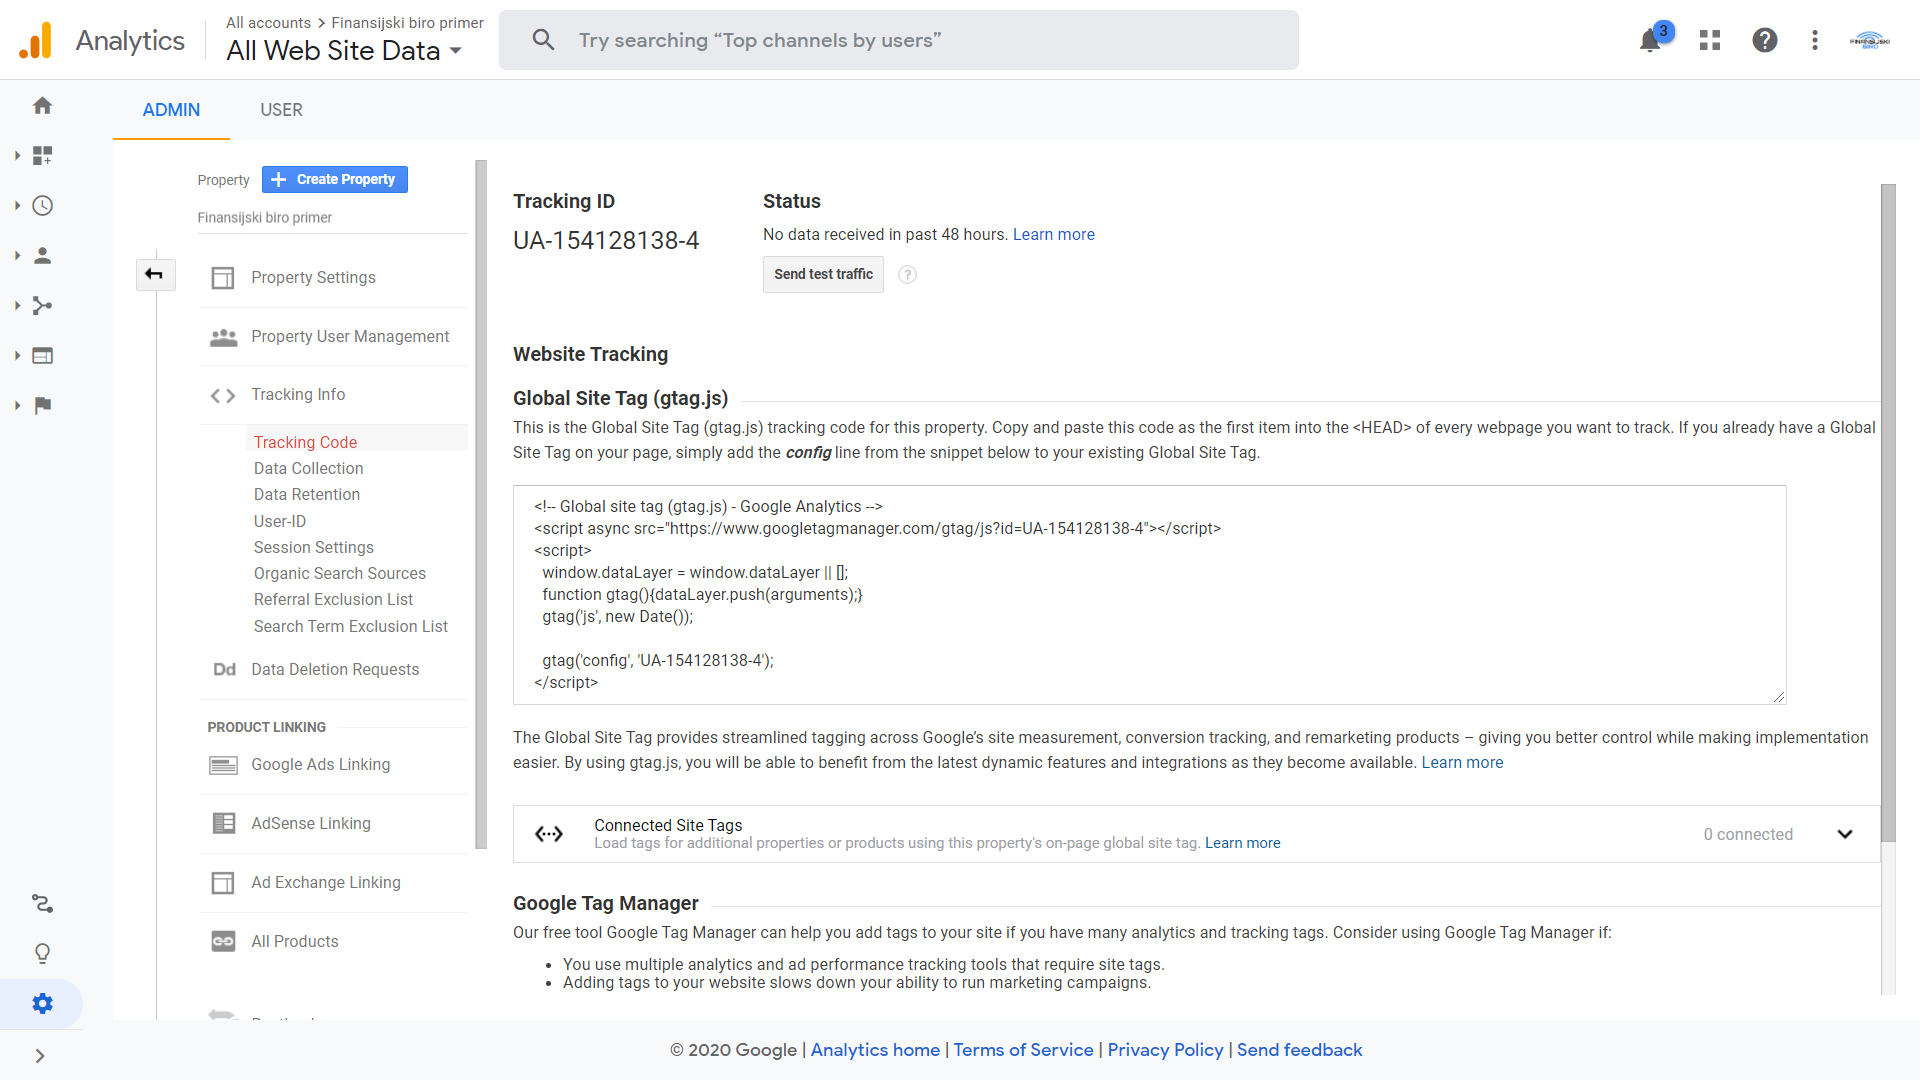
You need to insert the "Global Site Tag (gtag.js)" tracking code on your site so that Analytics can collect all the necessary data to display the report.
Copy and paste the code you get into the "head" of each page you want to track.
If you use PHP, the easiest way would be to insert the code into a page that runs through the entire site.
For example, you created a file located in the parts folder called head.php. In it, you have selected all the .css styles and other files that should be in the "head" to make it easier for you to manage the content and change all the pages in one pass, while making only one change. You definitely included that file in the "head" of each page to make your CSS styles and other included files work. Simply add the tracking code at the top of the head.php file code and you have covered the entire site with Google Analytics in one go.
Example function code include

More about the include function and its use in one of the next posts!
If you do not know how to implement Google Analytics yourself or have any other questions, feel free to contact us by clicking the button:
Contact Us